The Complex Relationship and Looming Crisis Between Our Thirst For Water and Our Hunger for Energy
July 20th, 2016
Via China Water Risk, a look at how wind & sun can help China’s parched North save water and still make power:
Highlights
-Resources severely mismatched in the North; solar & wind can save water equivalent up to 18% of the Western route
-3 northern provinces account for ~75% of China’s onshore wind & solar resource potential; but not all land is suitable
-Curtailment, up to 15% of wind power, remains key obstacle; recent regulations are trying to address the issues
It is not all doom and gloom for China’s parched North. Although the geographical mismatch of water and coal resources as well as water and arable land has resulted in an extremely high water stress in Northern regions, it is actually rich in… wind and sunshine. Albeit not a substitute for water, wind and sunshine can help power China with minimal water consumption. They could even reduce the actual amount of water use, were they to progressively offset thermal power generation in these regions. Yet here again, political and technological challenges remain.
Sunny and windy spots can help dry northern regions
Northern regions, with only 20-25% of China’s renewable water resources, account for 40% of China’s population, 51% of China’s thermal power generation, 82% of coal production and 86% of coal reserves. Such mismatch also exists for arable land, with a third of China’s sown area lying in the Dry 11 regions. No surprise then that these northern provinces are suffering extremely high water stress.
Resources are severely mismatched in the North but sun & wind are abundant
These very same provinces are also very rich in wind and sunshine, and this might prove a great asset to protect their water resources. As shown in the maps below, wind resource potential is mainly located in the North (Inner Mongolia) and along the separation between Xinjiang and Tibet. Sunshine is most abundant in Inner Mongolia, Gansu and most prominently the Qinghai-Tibetan plateau.
China’s Wind Resources
Land-based resource potential (WPD≥300 W/m2, 70 m height)Source: EIA and ERI
China’s Solar Resources
Average Global Horizontal IrradiationSource: SolarGIS © 2014 GeoModel Solar
Switching from thirsty coal to renewables could preserve water resources
Wind turbines and solar PV use minimal amount of water in their daily operation. As we discussed in our brief with IRENA earlier this year, progressively increasing the share of these renewable energy sources could help reduce the water intensity of power generation by as much as 42%, not to mention the benefits in terms of carbon emissions.
In a context of slow power demand growth, renewable energy could even progressively offset outdated and/or water-intensive coal power plants thereby decreasing the absolute amount of water use for power generation (which, according to estimates, accounted for almost half of industrial water use in Inner Mongolia in 2011). This would also help alleviate water pollution and impacts on groundwater associated with coal mining.
Wind & Solar in 2020 could ‘save’ up to 1,450 million m3/year, which is 18% of the Western route equivalent of water
How much water is ‘saved’ by wind and solar in 2020?
Back-of-the-envelope calculationAssuming…
Capacity: 250GW Wind + 150GW (link)
Operating hours: 1800-2000h Wind and 1300-1500h Solar
Water consumption of coal power plants: 0.35-2 m3/MWh…we get:
Water ‘saved’: 226-1,450 million m3/year (~3%-18% of the Western route of the South-North Water Diversion Project)
Coal ‘saved’: 271-304 million tonne/year
CO2 ‘saved’: 552-620 million tonne CO2/year
However, not all land is suitable for installing wind turbines and solar panels. For instance, the altitude of the Qinghai-Tibetan plateau and its remoteness prevent large-scale installation of renewable energy production systems.
Renewable energy potential concentrated in northern water stressed regions
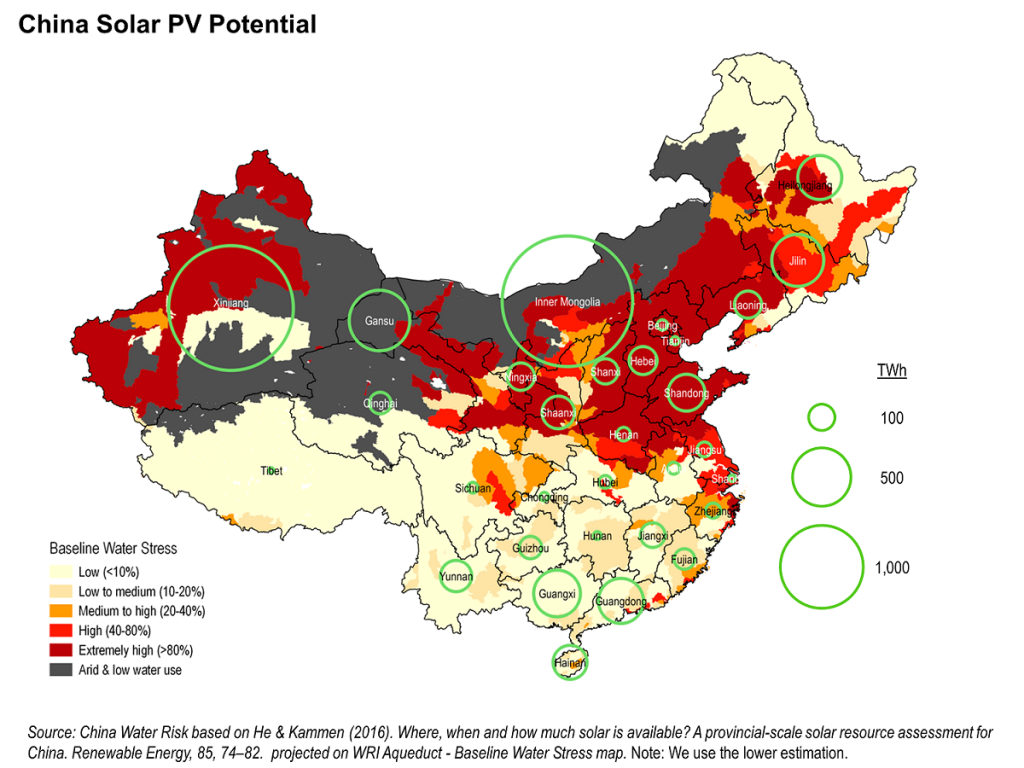
In two recent articles, He and Kammen identified provincial potential of wind and solar energy after excluding unsuitable land (e.g. higher than 3,500 meters, steep slopes, forests and croplands, sandy deserts). The results are shown in the maps below, projected on the WRI water stress map. Note: an updated version of this water stress map is now available. More on the improvements of the map here.
Xinjiang, Inner Mongolia & Gansu (water stressed regions) =
~75% of onshore wind & solar potentialXinjiang, Inner Mongolia and to a lesser extent Gansu show the greatest potential for renewable energy, mainly thanks to relatively high levels of wind and sunshine along with large amount of suitable land. Altogether, these three provinces account for around 75% of both onshore wind and solar PV potential in China. This could be good news for these heavily water stressed regions.
However, such a transition will take time: despite China’s aggressive expansion of renewable energy, coal produced approximately 18 times more electricity than wind and solar in 2015. And the growth of renewables is still being hampered by high curtailment rates.
Curtailment: up to 15% of China’s wind power generation wasted
The curtailment rate, i.e. the amount of power that could have been produced but wasn’t because it couldn’t reach end-users, is significant in China. This partly explains why China is generating less electricity from wind turbines than the United States, despite having close to twice as much installed capacity.
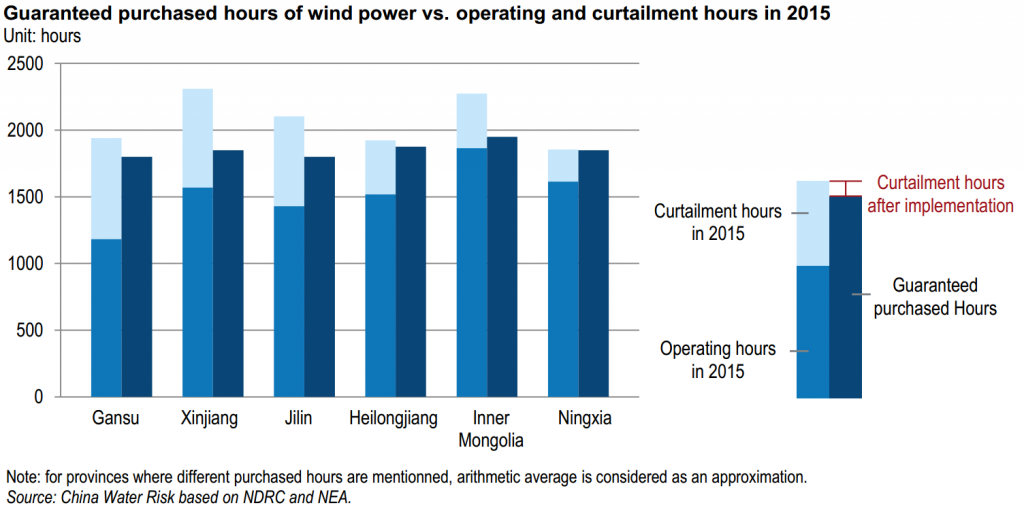
Northern provinces, which host most of China’s wind power, are precisely those with the highest curtailment rates – see the chart below. The amount of curtailed electricity has even been increasing from 2014 to 2015 despite repeated attempts by the National and Development Reform Commission (NDRC) and the National Energy Association (NEA) to address the issue.
Curtailment rate continues to be a key obstacle..
..up to 15% of wind power generation is wasted
Northern provinces are the most affected
So who is to blame for this waste of low-carbon and low-water energy?
Cutting the waste: bottlenecks are both technological – the grid…
One frequently mentioned obstacle is the limited grid infrastructure (both in terms of flexibility and long-distance/inter-grids capacity): the power generated in North and Northwestern regions rely on the grid to reach the coastal electricity consumers. The expansion of renewable (and coal) capacity has far outpaced the grid extension. Several Ultra High Voltage transmission lines are now under construction and in the meantime, China has put on hold the wind power expansion: no additional wind project should be approved in 2016 in these 6 provinces.
A recent Nature Energy article even suggested that once integration costs and curtailment are considered, “wind is not most cost-effectively installed in China’s wind-rich areas (the NW and NE), but instead should be located closer to demand centres”. However, the grid infrastructure is not the only culprit.
…and political – the power dispatch
The other crux of the matter is the power dispatch regulation, which frames how grid companies purchase electricity from generators. Historically, grid companies have given priority to coal-fired utilities, for various reasons. Things may change with the new regulations issued by the NDRC in March 2016: new rules guarantee wind and solar generatorsminimum amounts of purchased hours in selected regions.
A simple way to look at it is to compare these guaranteed purchased hours with 2015 operating and curtailment hours, in other words the maximum number of hours that wind turbines could have been spinning last year.
If properly implemented, this policy will go a long way towards curbing curtailment rates
The comparison shows that if properly implemented, this policy will go a long way towards curbing curtailment rates in these provinces. Here again the implementation will prove a daunting challenge as main actors’ incentives are notproperly aligned, and historical attempts to improve power dispatch have largely been unsuccessful so far. But the apparent determination of the National Energy Administration (NEA) offers some ground for optimism.
In a guideline published in March, the NEA required power generation groups to generate at least 9% of their electricity from non-hydro renewable sources by 2020. Companies who do not reach this quota would need to buy certificates from companies who exceeded theirs. One could read this as a way to progressively tie every power generation company to renewables’ fate. A side benefit from this increasing uptake of renewable could be a reduced exposure to water risks.
Increasing share of renewable means reduced exposure to water risks
We recently analysed thermal power generation and coal mining operations of 10 listed energy companies. Results show that up to 100% of coal companies’ output lie in extremely water stressed regions. The figure can be as high as 84% for thermal power generation – see the map below.
These companies are clearly exposed to water woes. In our on-going survey, we’re looking at potential impacts on P&L. Regulatory risks are also discussed. Investors, financial analysts, this is the last opportunity to provide your feedback on the valuation of water risks for 10 energy listed companies. Investors & analysts from 50+ financial institutions/funds already participated. Help the community fine-tune the valuation of water risks by clicking here.
This entry was posted on Wednesday, July 20th, 2016 at 9:56 pm and is filed under Uncategorized. You can follow any responses to this entry through the RSS 2.0 feed. You can leave a response, or trackback from your own site.
Leave a Reply
You must be logged in to post a comment.
Educated at Yale University (Bachelor of Arts - History) and Harvard (Master in Public Policy - International Development), Monty Simus has held a lifelong interest in environmental and conservation issues, primarily as they relate to freshwater scarcity, renewable energy, and national park policy. Working from a water-scarce base in Las Vegas with his wife and son, he is the founder of Water Politics, an organization dedicated to the identification and analysis of geopolitical water issues arising from the world’s growing and vast water deficits, and is also a co-founder of SmartMarkets, an eco-preneurial venture that applies web 2.0 technology and online social networking innovations to motivate energy & water conservation. He previously worked for an independent power producer in Central Asia; co-authored an article appearing in the Summer 2010 issue of the Tulane Environmental Law Journal, titled: “The Water Ethic: The Inexorable Birth Of A Certain Alienable Right”; and authored an article appearing in the inaugural issue of Johns Hopkins University's Global Water Magazine in July 2010 titled: “H2Own: The Water Ethic and an Equitable Market for the Exchange of Individual Water Efficiency Credits.”


